The pilot project was conducted by the University of Jyväskylä, S Group a customer-owned network of companies in the retail and service sector, and Sitra a food transport logistics company. The pilot focused on S Group’s impact on nature.
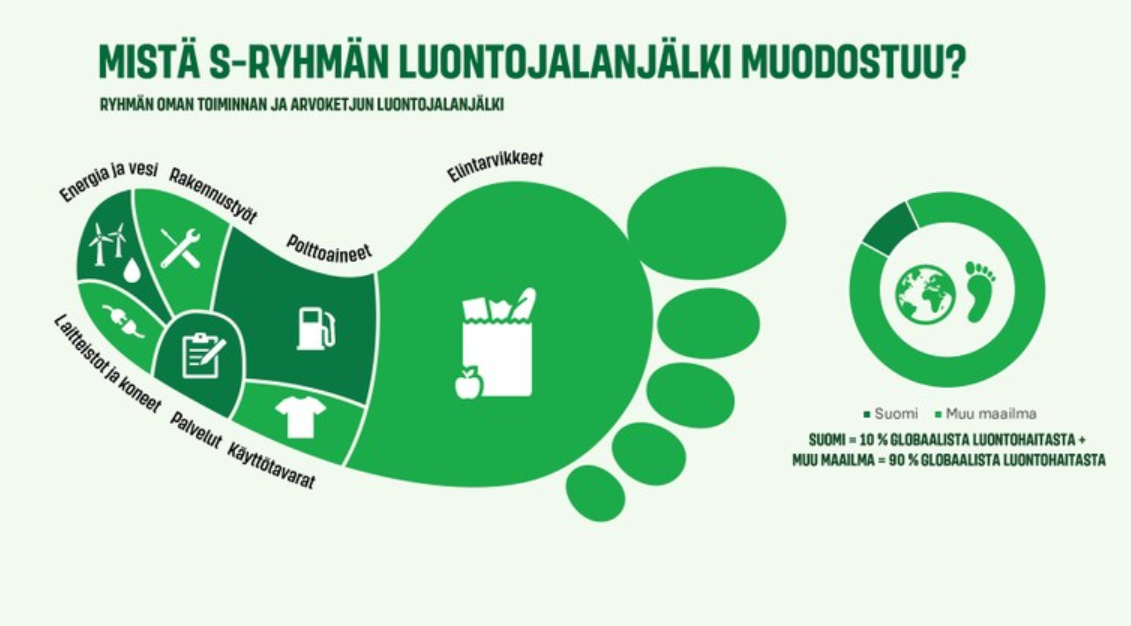
Food and fuels were found to be the largest contributors to S Group’s biodiversity footprint, with the majority of the footprint located outside of Finland’s borders. The S Group’s global biodiversity footprint is mostly generated in regions outside of Finland, such as Indonesia and areas around the equator, as well as Spain, the Mediterranean, and Brazil. Regions with high biodiversity tend to have a larger biodiversity footprint.
Biodiversity loss is one of the biggest global sustainability challenges, alongside climate change, the groups say. To be able to reduce the impact that their products and services have on the environment, companies must first understand the nature of these impacts.
The method’s development work is being financed by S Group and Sitra. The outcome of the study will be a method freely available to all companies and organisations for the assessment of their impact on nature.
“Companies already routinely calculate their carbon footprints. This project demonstrates that they can also calculate their biodiversity footprint. A company like S Group, with operations in several different sectors, played a key role in the method’s development,” said Janne Kotiaho, professor of ecology at the University of Jyväskylä.
S Groups biodiversity footprint assessment was based on scientific databases and the company’s consumption accounts. According to the University of Jyväskylä, this is the first time that a major trade group’s biodiversity footprint has been assessed.

US Tariffs are shifting - will you react or anticipate?
Don’t let policy changes catch you off guard. Stay proactive with real-time data and expert analysis.
By GlobalDataThe indicator of the biodiversity footprint is the share of the world’s species at risk of extinction, or the Potentially Disappeared Fraction (PDF) of species. The indicator allows for international comparison of different corporations’ biodiversity footprints.
“You have to tackle climate and biodiversity challenges hand in hand. As opposed to climate efforts, biodiversity impacts are very local. The report shows that there is a need for increasingly strong cooperation between businesses and partners operating within the same geographic area. Companies must also start building new kinds of cooperation networks to reduce their negative impact on nature,” said Nina Elomaa, senior vice president of sustainability at S Group.
The method’s development is significant because the global biodiversity framework agreed upon by nations at the Montreal Biodiversity Conference in December stated that in the future, large and transnational companies should disclose their negative impact on biodiversity.
Finland is also in the process of developing a national biodiversity strategy and its implementation programme. S Group’s goal is for its operations to be carbon-negative by 2025. The company is also committed to reducing its biodiversity impact by promoting more sustainable consumption and a planetary health diet, among other things.
The method is still being improved and refined. Once it’s complete, the public will have access to tools and methods to help companies plan more effective measures to prevent biodiversity loss in their value chains.


