A snapshot of the current state of play in US textile and apparel trade shows imports last year rebounded from a modest decline in 2012, retailers continued to diversify their supply chains, and Asia continues to dominate imports into the US.
The findings of the annual ‘Shifts in US Merchandise Trade 2013′ report from the US International Trade Commission (USITC), reflect a strengthening of the US economy and prove there has been a rise in consumers’ confidence in the country’s economy.
First and foremost, US imports of textiles and apparel in 2013 rose 3% or US$3.7bn to $117.2bn. The increase follows a fall of 0.1% in 2012, the first decline for three years.
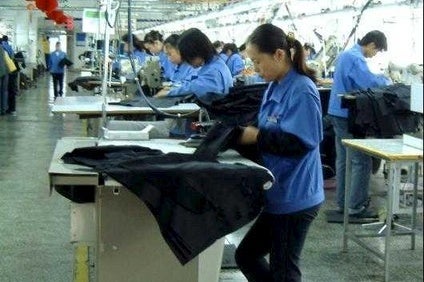
A significant share of the growth in imports of textiles and apparel in 2013 was accounted for by a $1.3bn increase in imports from China to $46.2bn, by far the leading supplier of textiles and apparel into the US. This compares to a rise of just 0.3% in 2012.
This largely reflects China’s ability to offset rising production costs by gains in productivity. China maintains significant advantages over other suppliers in economies of scale, infrastructure, efficiency, expertise, and stability. Despite stated efforts in recent years by US retailers to diversify their supply chains, China still dominates as a the country’s supplier of textiles and apparel, and is expected to remain the leading sourcing country.
Although consumers reportedly were more frugal in purchasing clothing relative to expenditures on other goods or services in 2013, the value of US apparel retail sales grew by almost 3%, reflecting growth of $6.9bn in consumer spending on garments.

US Tariffs are shifting - will you react or anticipate?
Don’t let policy changes catch you off guard. Stay proactive with real-time data and expert analysis.
By GlobalDataThis growth can be explained by higher sales volumes, as US imports of apparel by quantity, or square metre equivalents (SMEs), rose by 5% between 2012 and 2013. This was largely driven by a 5% growth in US imports of manmade-fibre apparel, which outpaced the 2% growth in US imports of cotton apparel.
US imports from Asia, the largest regional supplier – accounting for three-quarters of all sector imports – rose by $3.4bn, or 4%, to $88.1bn.
Almost as substantial as the increase in imports from China was the 14% growth in imports from Vietnam to $8.6bn, the second leading supplier of textile and apparel to the US. The US is Vietnam’s largest export market for textiles and apparel.
In 2013, several new textile and garment plants began production in Vietnam, and the anticipation of the proposed Trans-Pacific Partnership (TPP) has reportedly prompted the implementation of numerous fibre and textile projects to prepare for the possibility of greater market access.
US imports from South Asian suppliers Bangladesh and India also experienced significant growth, rising by $473m, or 10%, and $468m, or 7%, respectively, in 2013.
Despite political uncertainty, factory safety problems, and labour disturbances in 2013, US imports from Bangladesh continued to grow because the country’s low labour costs help it to meet the global market’s demand for competitively priced apparel. As a result, the Bangladesh textiles and apparel sector has been attracting business from international apparel brands and retailers such as Wal-Mart, JC Penney, and Gap, and others.
The growth in US textiles and apparel sector imports from India likely reflects the latter’s efforts to upgrade its technology, focus on innovation in product and design, and improve training.
US export trends
US exports of textiles and apparel rose by $543m, or 3%, to $19.8bn in 2013.
Unlike US imports, exports are largely composed of textiles, at 83% of the total. This is because textiles are most often used as intermediate inputs for finished products manufactured abroad, which are then imported back into the US.
The top markets for US textile exports continued to be Mexico and Canada, partner countries in the North American Free Trade Agreement (NAFTA), and Honduras, a partner country in the Dominican Republic-Central America-United States Free Trade Agreement (DR-CAFTA) – which collectively accounted for 48% of exports in 2013.
In addition to preferential duty treatment, these partners benefit from shorter lead times because of their proximity to the US market.
Since many of the fibres, yarns, and fabric exported to NAFTA and DR-CAFTA partner countries re-enter the US as finished garments, demand for US textiles is closely correlated to imports of apparel from these countries.
US exports of fabrics continued to lead sector exports, rising 3% to $6.5bn. These exports were followed by US exports of fibres and yarns (excluding raw cotton and raw wool), which also rose 3% to $5.2bn.
US trade balance
Taken together, the figures mean that in 2013, the US trade deficit in textiles and apparel rose 3.4% to $97.5bn, the result of a substantial $3.7bn increase in US imports that outweighed a small increase in US exports.
Four categories – shirts and blouses; home furnishings; women’s and girls’ trousers; and men’s and boys’ trousers – together accounted for 48% of US imports of textiles and apparel in 2013.
The US continued to register a trade deficit in textiles and apparel with several of its top trading partners in this sector in 2013. The largest trade deficit increases were with China ($1.1bn), Vietnam ($1.1bn), and India ($480m).
Continuing a trend that began in 2009, the US trade deficit with Mexico shrank in 2013, falling by $214m (13%) to $1.4bn as the $258m increase in US exports to Mexico outpaced the $43m increase in US imports from that country.
China remained the largest supplier of US imports of textiles and apparel in 2013, accounting for almost 40% of US imports of these products.
Click here for a separate snapshot of US footwear trade and sourcing.


